|
Roger Cortesi
Document Version 1.8: November 12, 2006
This document is copyrighted by Roger Cortesi 2005.
I created the Digital Athletic Log to keep track of my marathon and triathlon training progress. None of the logging software available had the all the features I wanted. I also needed a solution that would work across many platforms (I regularly use: OS X, Linux, FreeBSD, and alas even Windows). The Digital Athletic Log offers the following features:
Appendix C has many examples of ways in which I use the Digital Athletic Log to help me train. Additionally, my training routine is heavily based on SERIOUS Training for Endurance Athletes by Rob Sleamaker and Ray Browning (Reference [3]). The Digital Athletic Log has several features to help manage a training plan using the SERIOUS method. These include:
See Appendix D for how I use the Digital Athletic Log with the SERIOUS method.
This section demonstrates the minimum steps to get your account up and running. You can try the Digital Athletic Log by logging in to the `demonstration' account. The username and password are `demo'.
At this point you may make entries in the Digital Athletic Log for your sport(s) using the ``Make a sport entry'' link. You may also create keywords using the ``Edit your... keywords'' link. Once you have at least one keyword created, you may create ``keyword entries'' with the ``Make a keyword entry'' link.
If you created more than one sport or keyword, edit you profile to select your default sport and keyword.
The Digital Athletic Log stores two types of entries for your training: sport entries and keyword entries.
Sport entries are designed to log things like running, swimming, kayaking, etc. Sport entries have many fields associated with them (date, time, sport, duration, distance, altitude, temperature, heart rate, remarks, etc.)
Keyword entries are used to log data that does not fit the sport model. Examples include: weight, resting heart rate, date of last sneaker replacement, etc. Keyword entries can also be linked to a sport entry to create additional fields for the sport entries (i.e. adding a depth field to support a scuba diving sport). See section 12.1 for more information.
When making sport entries, pace is automatically calculated based on the distance and duration values entered.
Entries may be edited by selecting their ``edit'' link on the main page (the ``Home'' link) or the view log page (the ``View your log entries'' link).
Entries cannot be deleted. If you make an entry in error, use it for your next good entry (instead of creating a new entry).
If you commonly exercise using a couple of set routes, you can define routes using the ``Edit your... routes'' link.
The main page (the ``Home'' link) displays a summary of most of the different parts of your training log. These include:
Log entries made in the last seven days are displayed on the main page. To view entries older than seven days, use the ``View Log'' page (the ``View your log entries'' link).
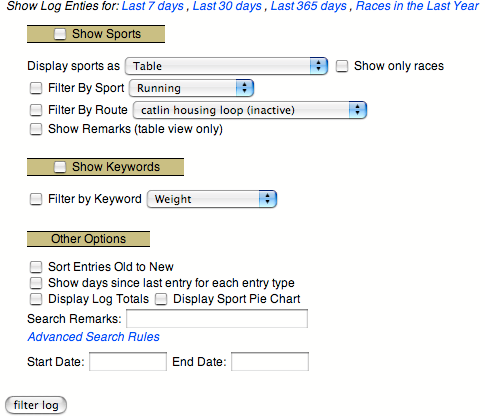
If you leave the start and stop date fields blank on the ``View Log'' page and select the ``Show Sport Entries'' check box, all of your sport entries will be displayed. The ``View Log'' page allows you to filter the displayed entries by sport, route, date, etc.
The ``View Log'' page also displays the total time, total distance, min/average/max pace information for all the sport entries displayed.
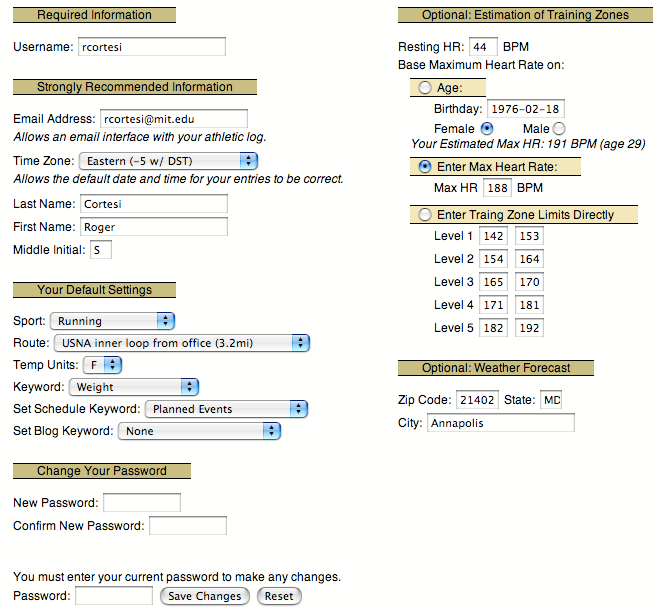
Your profile is edited by selecting the ``Edit your: profile'' link.
To make any changes to your profile you must enter your current password at the bottom of the form.
Very little information is required to make your account functional. The minimum required information is your username and a password.
It is strongly recommended (but not required) that you also enter the following information:
If you have multiple sports, routes or keywords you may specify which should be used as the initial menu option throughout the log.
You may specify your default temperature units.
The ``Schedule'' keyword is an optional feature used with goal processing. See the Section 8 for more information. If you are not using the goal feature, you do not need to set a ``Schedule'' keyword.
The ``Blog/Journal'' Keyword is an option feature for designating a keyword to make non-sport specific entries which are displayed with your sport entries. See Section 6 for more informaiton about the the ``blog view''.
You may share your log with others, allowing them to view your recent entries and goals. See Section 12.6 for more information.
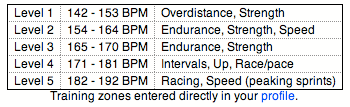
This section of your profile calculates the heart rate ranges for your training zones. For more information on the purpose of the training zones see Reference [3, pp 26-30]. Training zones can calculated several ways.
The city and state fields are used to display your current weather forecast. The zip code field is used to look up your weather if the city and state don't produce a weather link. Users outside the United States use a weather station ID number entered in the zip code field (See Section 12.4 for details).
The weather information is from the weather underground. See Section 12.4 or email me if you are having getting the weather forecast to display properly.
Sport entries are the heart of the Digital Athletic Log. Before you can create sport entries you must create a list of your sports.
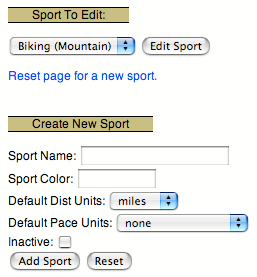
Your list of available sports are created and edited from the ``Edit your... sports'' link. Figure 3 shows the edit sports form.
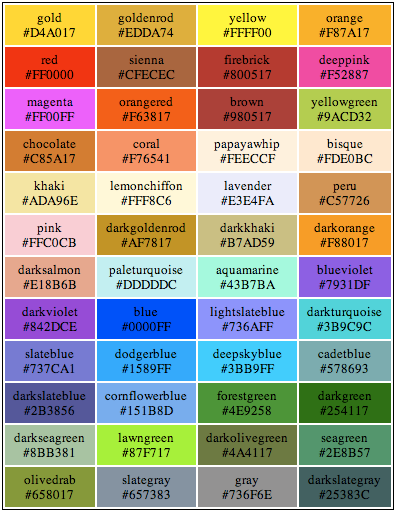
Each sport can have a color associated with it. The color is used to highlight the entry and color code plots. Colors can be specified by either name or by 6 digit hex code (i.e. #ff00ff for purple). If you specify a color by hex code, you must include the `#' sign in front of the hex code. Avoid the colors white and black. White will not show up on the graphs. Black will hide text in the log. Appendix B lists recommended colors and color codes.
Each sport also has default distance and pace units associated with it. These defaults are used to:
If you no longer want to use a particular sport, check the ``inactive'' checkbox. This removes the sport from the sports menus. This does not delete the sport. The sport can be reactivated at any time by unchecking the ``inactive'' checkbox. Past entries for that sport will still be visible.
If you change the name of the sport, all entries using that sport will be updated too.
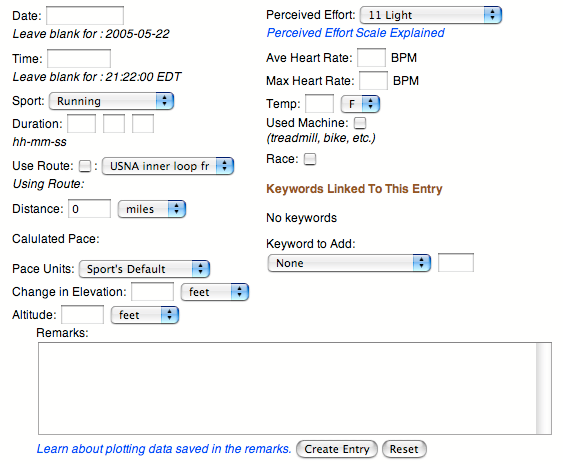
Once you have created a list of your sports, you may create sport entries. Each sport entry can store the following information:
You can add your own fields to a sport entry by linking keyword entries to sport entries. See Section 12.1 for more information on linking entries.
Many formats can be used when specifying the date and time for entries . For example: ``3/18/05'', ``18MAR2005'', or ``2005-03-18'' are all acceptable. Additionally, you may specify the date with expressions like ``today'', ``yesterday'', ``-2 days'', ``+1 month''. If you leave the date or time fields blank the current date or time will be used (assuming your profile has the correct time zone set).
The duration's minutes and seconds fields are not limited to 0-59. A duration of 68 minutes is converted to 1 hour and 8 minutes.
Pace is automatically calculated based on the distance and duration values entered.
Entries may be edited by selecting their ``edit'' link when they are displayed on the main page (the ``home'' link) or the view log page (the ``View your log entries'' link).
Entries cannot be deleted. If you make an entry in error, use it for your next good entry (instead of creating a new entry).
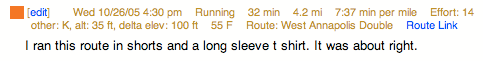
You cannot store html tags in the remarks field. However, if you enter a URL in the remarks it will be displayed as a hyperlink. The URL must start with either `http://' or `https://'.
The log stores the duration, distance, pace, altitude, change in elevation, and temperature data in SI units. This allows entries to be made in the units which are most convenient. For example, if you ran a 5K one day and 3 miles the next, the entries can be made in those units. Both will be stored internally as meters. This allows total distance and average pace to be calculated correctly.
An entry's route can be mapped and measured using the Gmap Pedometer. Gmap Pedometer can generate a URL link with the path information encoded in it (the Permalink or tinyURL options). You may bookmark this link in your browser to recall the map later. Additionally, if you paste the complete URL (including the http://) into the remarks field of the entry, a link to the map will be available when the entry is displayed.
If you commonly exercise using a couple of set routes, you can define routes using the ``Edit your... routes'' link. Selecting a route from the route menu AND checking the ``Use Route'' checkbox will cause the route's distance, altitude, and change in elevation data to override the values entered in the sport entry form.
Perceived Effort is entered on a scale from 6 to 20. This is based on the Borg scale. 6 is resting and 20 is your maximum effort. The scale starts at 6 because multiplying the perceived effort number by 10 approximates your heart rate.
The following examples are from: The Borg Rating of Perceived Exertion Scale
9 corresponds to "very light" exercise. For a healthy person, it is like walking slowly at his or her own pace for some minutes
13 on the scale is "somewhat hard" exercise, but it still feels OK to continue.
17 "very hard" is very strenuous. A healthy person can still go on, but he or she really has to push him- or herself. It feels very heavy, and the person is very tired.
19 on the scale is an extremely strenuous exercise level. For most people this is the most strenuous exercise they have ever experienced.
Keyword entries are used for data which does not fit the sport model. Weight, resting heart rate, date of last sneaker replacement, are all examples of data which could be stored using keywords. Keyword entries may also be linked to sport entries to create additional fields in sport entries (i.e. adding a depth field to a scuba diving sport). See Section 12.1 for more information on linking entries.
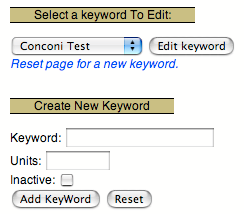
Before you can create keyword entries, you must create a list of your keywords using the ``Edit your... keywords'' link.
Each keyword can have optional units associated with it. The units are for display only. No calculations are performed using the units.
When you no longer want to use a keyword, check the ``inactive'' checkbox. This will remove the keyword from keywords menus. This does not delete the keywords. The keyword can be reactivated at any time by unchecking the ``inactive'' checkbox. Past keyword entries for the inactive keyword will still be displayed on the ``View Log'' page.
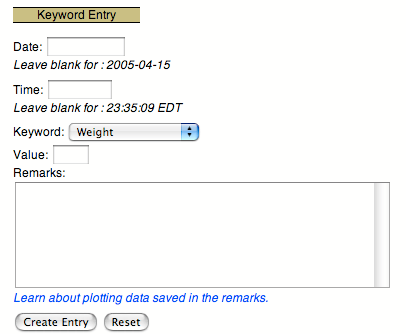
Entering the date and time for the keyword entry is the same as entering it in a sport entry. See Section 4.2 for more information on entering date and time values.
Keyword entries can be edited by selecting their ``edit'' link when they are displayed on the main page (the ``home'' link) or the view log page (the ``View your log entries'' link).
Keyword entries cannot be deleted. If you make an entry in error, use it for your next good entry (instead of creating a new entry).
Keyword entries store a value for a keyword and some remarks. You can not store html tags in the remarks field. However, if you enter a URL in the remarks it will be displayed as a hyperlink. The URL must start with either `http://' or `https://'.
The Digital Athletic Log allows you to designate two keyword as special. In your profile, you may designate a ``Schedule'' keyword and a ``Blog/Journal'' keyword.
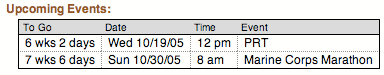
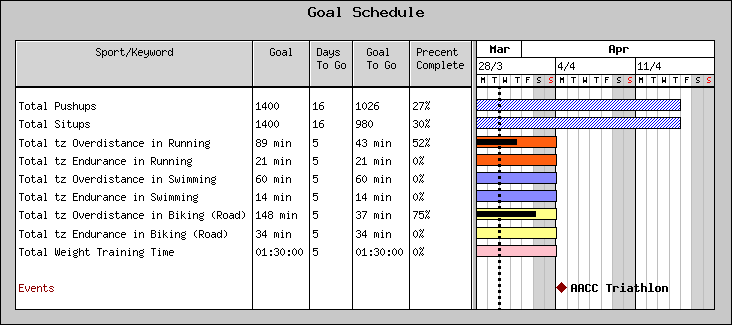
The ``Schedule'' keyword is used to store information about future races or events. The main page displays a listing of the weeks and days until upcoming events (Figure 7). These stored events can also be displayed on the view goals plot (see Figure 19).
To create your race or event listing for the first time:
To create additional race or event listings, only perform step 3.
The ``Blog/Journal'' keyword allows you to make keyword entries which appear with the sport entries the ``blog view'' of training log (which is good for reading remarks). This is useful for end-of-week summaries and other notes, which you would like to see when reviewing your sport entries, which making a sport entry. See Section 6.2 for more information about the ``blog'' view.
The last seven days of sport and keyword entries are displayed on the main page of the Digital Athletic Log. To view entries older than seven days or to apply filtering to the log, go to the ``View Plots'' page (the ``view your log entries'' link).
Sport entries can be filtered to show only races, a single sport, or a single route. The default sorting order is recent entries on top.
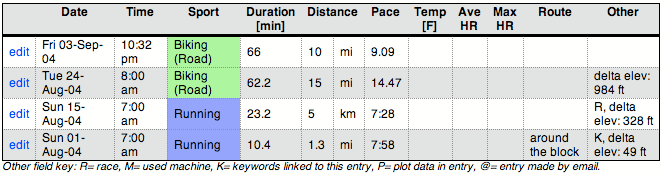
When viewing sport entries there is an `other' field. This field may contain several symbols.
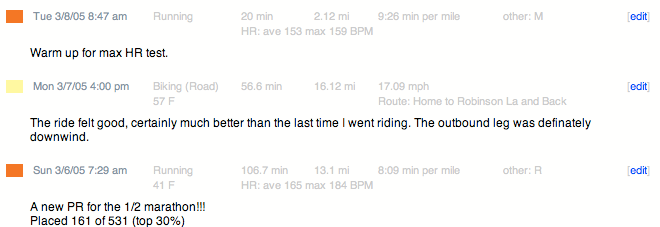
You can view sport entries in either a `table' or `blog' format.
The table format is designed to show many enties in a small space. By default, remarks are not displayed in the table format. The `show remarks' checkbox overrides this. This is useful for locating a particular entry to edit, or to compare the numerical values between entries (plots are also a good way of comparing numerical values).
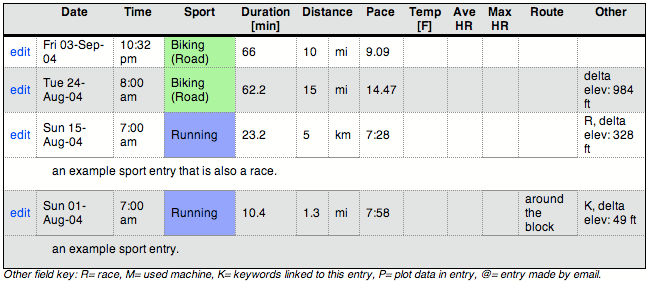
The blog format is designed to be easy to read the remarks.
Additionally, if you specify the `blog/journal' keyword (in your profile). The remarks for the blog keywords may be displayed in the blog view. This is useful, for writing notes that don't correspond to a sport entry (like a weekly summary). If the `blog keyword' is specified, the blog view has several modes:
You may perform a text search on the remarks fields of keyword and sport entries using the ``Search Remarks'' field.
Search terms less than four characters long are ignored. For example, searching for `hat' will return no results, even if the word hat appears in the remarks. This includes short words in phrases. Searching for ``my blue hat'' will only return entries with the word ``blue'' in the remarks.
Also by default the search function only returns whole word matches. So if you searched on the word ``ache''. Only entries with the word ``ache'' in the remarks would be returned. Entries with the word ``aches'' would not be returned. If you would like to return both ``ache'' and ``aches'' then search on ``ache*'' (where * matches 0 or more letters or numbers in the word).
A leading plus sign indicates that this word must be present in every entry returned. For example `+blue'.
A leading minus sign indicates that this word must not be present in any entry returned. For example, searching for `pool -ymca' will return entries that have the word pool in the remarks but not `ymca'.
You may search for phrases by using double quotes `` ''. For example ``big blue hat'' will return entries with exactly that in their remarks.
Searches are case insensitive.
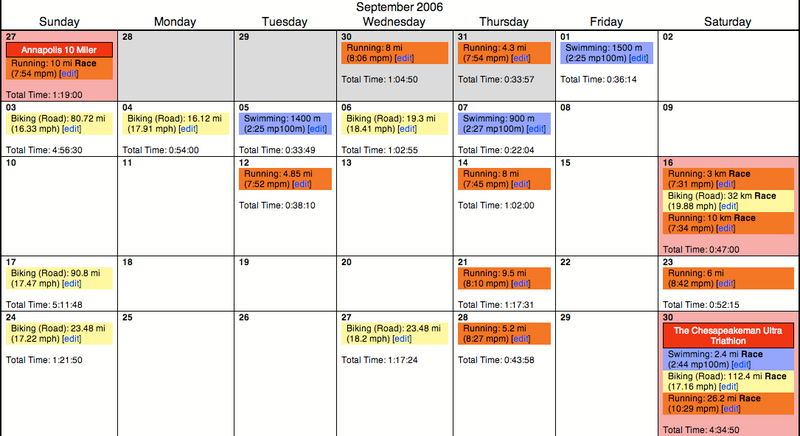
The log can also be displayed on a monthly calendar (Figure 12). The calendar view displays the sport entries made on each day and the and `planned events' keyword. Days on which races have been run (i.e. a sport entry with the race checkbox checked) are colored pink.
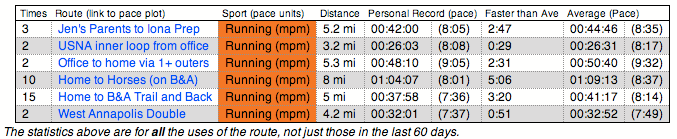
If you use several routes repeatedly, you may define routes with the ``Edit your... routes'' link. Each route stores distance, altitude, change in elevation, and remarks. When the route is selected in the sport entry, the route's distance, altitude, and change in elevation are used for the sport entry.
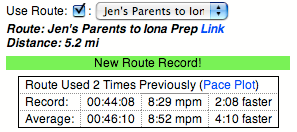
Defining routes allows you to compare workouts made over the same course. The ``View Logs'' page and pace plot may be filtered to display only entries using a particular route.
The log will also calculate and display your personal records and statistics for each route.
|
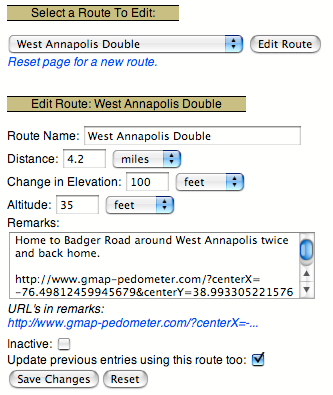
A route can be mapped and measured using the Gmap Pedometer. Gmap Pedometer can generate a URL link with the route's information encoded in it (the Permalink or tinyURL option). You may bookmark this link in your browser to recall the route's map later. Additionally, if you paste the complete URL (including the http://) into the remarks field of the route, a link to the route's map will be available in every entry using the route (see Figure 16).
If you change the route's name, the change will affect all entries using the route.
When a route is edited, selecting the ``Update Past Entries'' checkbox, applies the changes in distance, altitude, and change in elevation to all entries using the route. The entries' pace is also recalculated.
When you no longer want to use a route, select the ``inactive'' checkbox. This will remove the route from the route menus. This does not delete the route. Past entries made with that route will still be displayed. The route can be reactivated at any time by unchecking the ``inactive'' checkbox.
|
|
Goals are used to track your progress in a particular sport or keyword.
All goals calculate goal progress using entries between the goal's start and stop dates (inclusive). There are four goal types:
Goals are created and edited with the ``Edit your... goals'' link.
Initially only current and future goals are displayed in the ``Select a Goal to Edit'' menu. There is a link to display all your goals in the menu.
Dates may be specified in a variety of ways. All the common formats are supported (i.e. m/d/yy, yyyy-mm-dd, etc.) Additionally, the date may by specified by ``next Tuesday'' or ``+ 6 days''. In the `end date' field. The letters ``sd'' represents the goal's start date. For example, entering ``sd + 6 days'' in the `end date' field, sets the goal's end date to 6 days after the start date.
``Sport Distance'' and ``Sport Time'' goals require that you specify a sport. ``Keyword Sum'' goals require you to specify a keyword. ``Sum Keyword for a Sport'' goals requires you specify both a keyword and sport.
The goal value is assumed to be in the default units for the sport or keyword. The sport and keyword units are displayed in parentheses in the sport and keyword menus.
When a goal is selected to edit, a sample goal plot is displayed at the bottom of the ``Edit Goal'' page.
A table summarizing the progress of goals currently in effect is displayed on the main page.
Goals for any time period can be viewed with the ``View your... goals'' link.
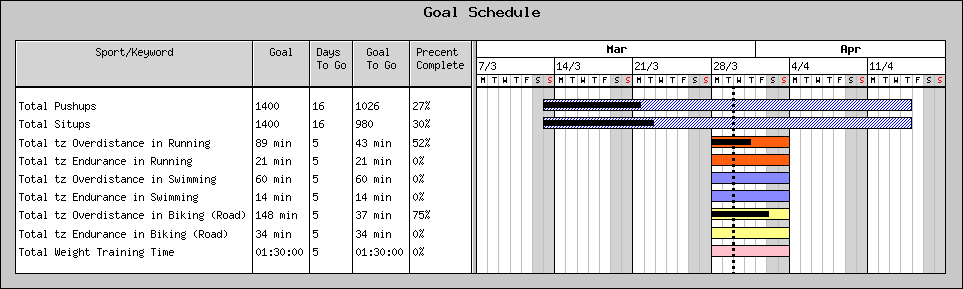
The ``View Goals'' page can display active goals between any two dates. The page initially displays goal that are active today. It displays both a plot of your goal progress on a calendar and a table summarizing your goal progress.
Figure 18 displays 9 goals. The first two (`Total Pushups' and `Total Situps') are keyword goals spanning several weeks. Goal names are generated automatically based on the goal type.
The `Total tz Overdistance in Running' is a `Sum Keyword for Sport' goal. The keyword is `tz Overdistance' and the sport is `Running'. This goal will sum all the values for the keyword `tz Overdistance' (whose keyword units are minutes) which are linked to a `Running' entry.
The `Total Weight Training Time' is a `Sport Time' goal. The total duration for all `Weight Training' entries between the goal's start and end dates is calculated, and compared against the goal value.
The number of days remaining in the goal and `goal to go' are displayed for each goal. The black progress bar on a particular goal bar shows the percent goal progress. The vertical black dotted line shows the current date. Goals that are associated with a particular sport have there bars color coded with the sport color.
The ``Show Planned Events/Races'' checkbox allows events (like races) to be displayed on the goal plot. To use the ``Show Planned Events'' feature do the following:
You may view plots of your training data by selecting the ``View your... graphs'' link. Currently there are five plots available from the ``View Graphs'' page. See Section 8 for information on plotting goals, and Section 12.3 for information on plotting data in the remarks fields of entries. The ``Goal Plots'' are displayed on the ``View your... goals'' page. Plots in the remarks of entries are displayed when the entry is edited.
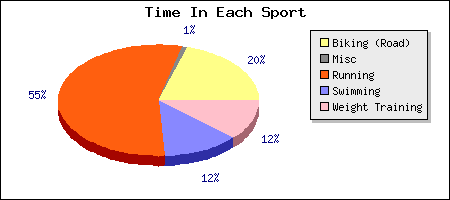
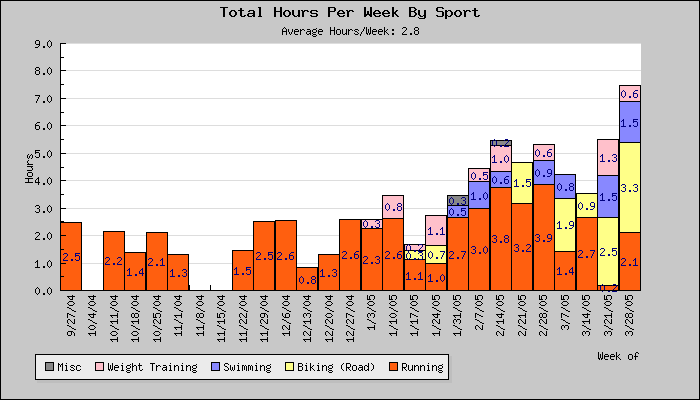
The plotting feature I use most often is the ``View summary for Last 3 Months'' link (Figure 20). This displays training data for the last three months using a ``Time in Each Sport'' pie chart (Figure 21) and an ``Hours per Week'' plot (Figure 22).
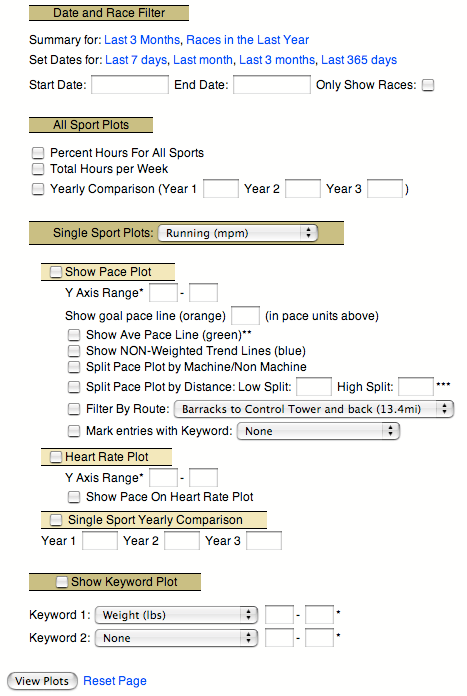
The date range specified at the top of the page applies to all the plots generated by the page. This allows an easier comparison between different plots. Several of the plots allow you to manually specify the scale of the y axis. This can clarify a plot.
Figure 21 displays the fraction of time spent in each sport during the specified date range.
Figure 22 displays the total hours for your sport entries by week. Each week's bar is color coded by the amount of time spent in each sport. If the plot is displaying less than 27 weeks, each sport is labeled with its total duration (in hours). Additionally, it displays the average hours per week for the time period plotted.
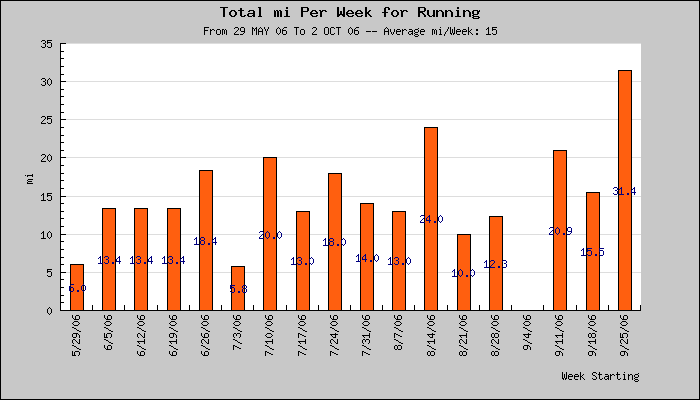
Figure 23 displays the total distance per week for a specified sport.
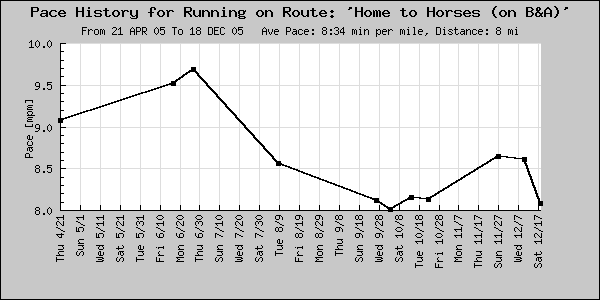
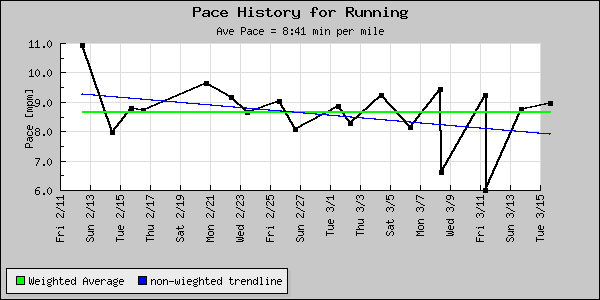
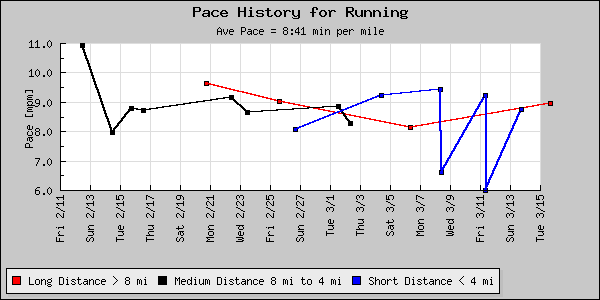
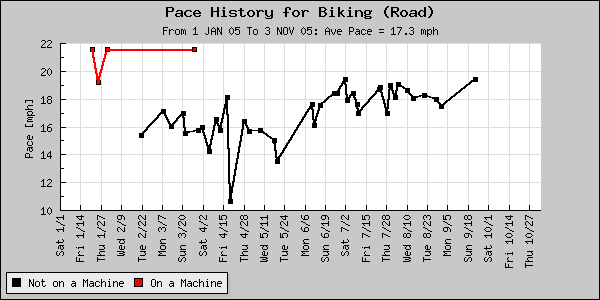
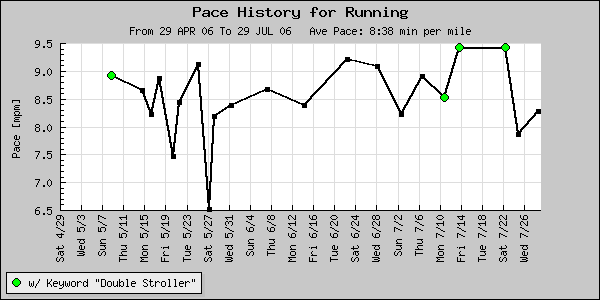
The pace plot (Figures 24, 25 and 26 ) displays pace data for the specified sport. Additionally, it can superimpose the following data on the pace plot:
|
|
|
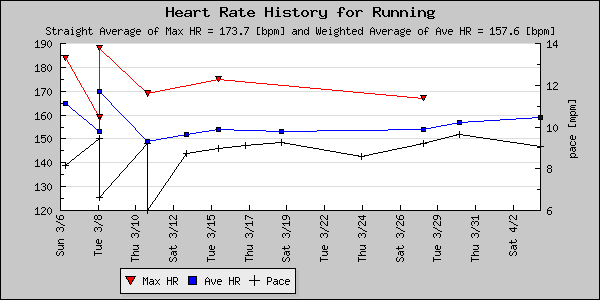
The heart rate plot (Figure 28) displays the maximum and average heart rate values entered in sport entries. Only data from the sport selected in the pace plot section is displayed. The pace data can be displayed on the heart rate plot as well.
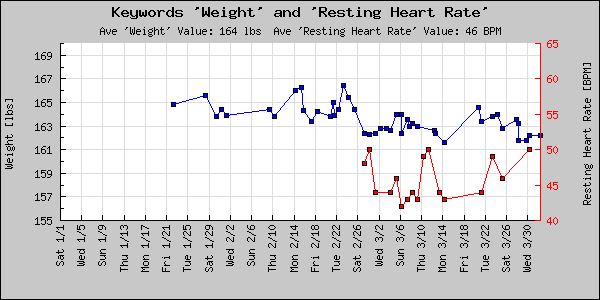
Figure 29 is the keyword plot, It can display one or two keywords over the specified date range. The average value (also over the specified date range) of each keyword is displayed in the subtitle. If the two keywords selected the have the same units, both will be plotted on a single Y axis. If the keywords have different units, they are plotted using different Y axes.
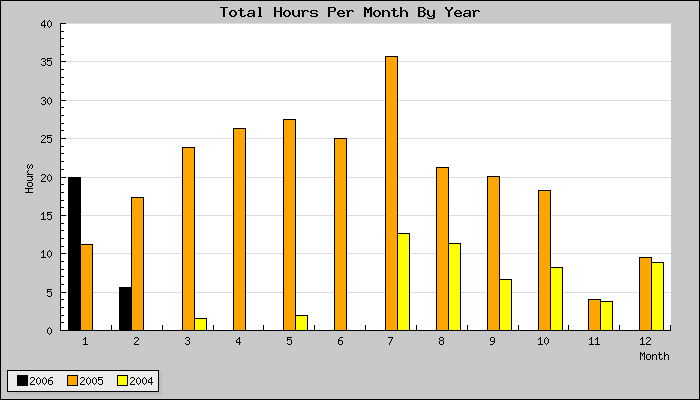
Figure 30 is the yearly comparison plot. This plot allows you to specify up to three years and it will plot your total total hours per month for each of these years. The plot can also compare only race hours or only hours in a single sport.
The ``Export log'' link allows you to download your data from the Digital Athletic Log in several formats. This allows for a method of data backup or analyzing your data in a spreadsheet.
On the topic of data backup...
The Digital Athletic Log is usually backed up nightly to at least one other computer. While I'm not about to offer any sort of data reliability guarantee, I personally have hundreds of entries in the Digital Athletic Log, and don't want to lose my data either. So I regularly test the automated backup solutions. If you are really paranoid about data loss, make hardcopy records of your training... I do.
A good technique is to print the quarterly summary to a PDF file for archiving.
Because computer systems are continually evolving, there is no way to really ensure that data entered in the training log will be readable in 20+ years. The best method for ensuring the long term readability of your training log data, is to periodically print your training records.
The ``Generate Report'' function is designed to make this as easy as possible. You specify the start and end dates, and which sections the report should include. The report can include:
Browser Note: Most modern browsers will print the report properly. Firefox, Opera, Internet Explorer, and Safari have all been tested successfully. Older versions of Safari may crash when the report is printed. Upgrading to version 1.3 or later fixes this.
The data data from your training log can be exported as a comma separated value (.csv) file. The .csv file can be used to backup the data or analyze it in a spreadsheet.
The following changes are made to the data to format it as a .csv file:
You can use a comma separated value file (.csv) to upload goals and entries to the Digital Athletic Log. Most spreadsheets (Excel, OpenOffice, etc.) can save data as a .csv file. If you have been keeping your training log in an spreadsheet you can upload all of your past data to your account on the Digital Athletic Log. This feature is also useful for uploading a large number of goals at once (the whole season for example).
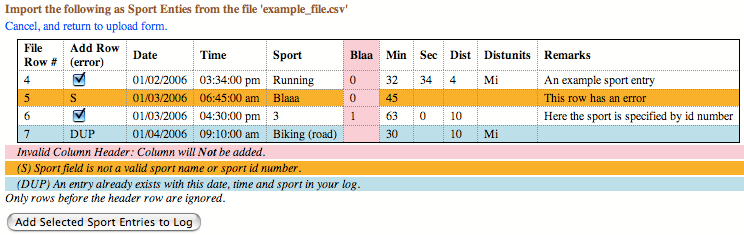
When a file is uploaded it is validated and displayed. Rows with no validation errors may be added to the Digital Athletic Log.
There are three upload types: goals, sport entries, and keyword entries. The Digital Athletic Log determines the type of data being uploaded automatically based on the column headers in the .csv file. Each upload type requires a minimum set of columns. Files without the minimum number of columns are not processed. Processing of the csv file is case INsensitive.
There are template .csv files for each upload type available from the bulk upload page.
|
| Upload Type | Minimum Columns |
|---|---|
| Sport Entries | `date', `sport' |
| Keyword Entries | `date', `keyword' |
| Goals | `startdate', `enddate', `type', `value' and ( `sport' or `keyword') |
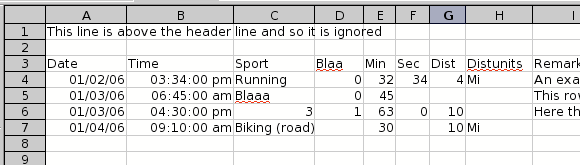
Additionally, each upload type will only recognize specific column headers. Column headers which do not match the allowed columns for the upload type are ignored (see Figure 32).
| Upload Type | Allowed Columns |
|---|---|
| Sport Entries | `date', `time', `remarks', `sport', `dist', `distunits', `hrs', `min', `sec', `avehr', `maxhr', `route', `temp', `tempunits', `alt', `altunits', `deltaelev', `elevunits', `effort', `race', `machine', and `paceunits |
| Keyword Entries | `date', `time', `keyword', `value', and `remarks' |
| Goals | `startdate', `enddate', `type', `value', `sport', and `keyword') |
Sports and keywords may be specified by either their id number or full name (case INsensitive). The bulk upload page lists the full names and id numbers of your sports, keywords, and routes.
If distance or pace units are not specified, then the sport's default units are used.
Other fields my only take certain values. These are listed below.
| Column | Allowed Values |
|---|---|
| distunits | `mi', `km', `yd', `m' or blank |
| paceunits | `mpm', `mpk', `mph', `kph', `mp100y', `mp100m', or blank |
| tempunits | `C', `F', or blank |
| race | `yes', `y', `x', `1', `no', `n', `0' or blank |
| machine | `yes', `y', `x', `1', `no', `n', `0' or blank |
| type | `sdst', `stime', `ksum', or `sksum' |
See Section 8 for more information about goals. But a quick summary
For example, you could store the maximum depth information with a sport entry for scuba diving. Or you could store the amount of time spent in a training zone for a running entry. Fields are added to a sport entry by linking keyword entries to the sport entry.
Entries are linked by setting the keyword entry's date and time to match the sport entry's date and time. The sport entry form has a keyword menu for doing this automatically.
When you change the date or time of a SPORT entry linked to keyword entries, the keyword entries' date and time are updated to maintain the link.
Sport entries, which have keywords linked to them, display a `K' in the `other' column of the sport entry log.
To unlink a keyword entry from a sport entry, change the KEYWORD entry's date or time.
In addition to making entries to the Digital Athletic Log via the web, you may make entries to your training log by email. This is useful if you can't get to a web browser, but you have access to email. Most cell phones can be used to send an email via simple text message.
To make an entry via email you must send a formatted email to entry@athleticlog.org. The Digital Athletic Log ingests email to the training log at 05 and 35 minutes past each hour.
The following line in the body of an email sent to the Digital Athletic Log creates a log entry:
u=joeuser|s=running|d=8/2/04|t=4pm|min=21|dst=5
This adds a `running' entry to joeuser's training log, with a date of 2004-08-02, a time of 16:00:00, a duration of 21 minutes, and a distance of 5 (using default units for `running').
Notice the fields are separated by the `![]() ' (shift `
' (shift `![]() ') character or any form of white space (space, tab, newline, etc.). Each field takes the form
') character or any form of white space (space, tab, newline, etc.). Each field takes the form
![]() . The entry MUST contain the username field (`u') and either a sport (`s') or keyword (`k') fields, or it will not be ingested to the log.
. The entry MUST contain the username field (`u') and either a sport (`s') or keyword (`k') fields, or it will not be ingested to the log.
The example below shows the same entry written with spaces and newlines separating the fields:
u=joeuser s=running
d=8/2/04 t=4pm
min=21 dst=5
When an entry is made by email, the Digital Athletic Log sends a receipt summarizing the entry to the email address which made the entry and to the email address on file for the username. The receipt sometimes gets tagged as spam by email software.
If the entry's date (`d') or time (`t') fields are not specified, the Digital Athletic Log will set them to the time the email was ingested.
Sports and keywords may be specified either by their name or their ID number. If the sport's or keyword's name has spaces in it, do not type the spaces. For example, if the sport name is ``Weight Training'', then the sport field in the email would be ``s=weighttraining''. The sport and keyword names are case insensitive. With the exception of spaces, the names must be entered verbatim. If `2' is the ID number for the `running', the first example can be written:
u=joeuser s=2 d=8/2/04 t=4pm min=21 dst=5
Making a keyword entry by email is very similar to making sport entry. The sport field (`s') is replaced by the keyword field (`k'). The keyword value is entered using the keyword value field ('kv').
u=joeuser k=pushups d=8/2/04 t=4pm kv=60
The above example would make an keyword entry of 60 pushups in joeuser's training log for 2004-08-02 at 16:00.
Below is a list of the fields recognized by the Digital Athletic Log.
Fields for both sport and keyword entries:
    u...username (required)
    d...date of entry
    t...time of entry

Fields for keyword entries:
    k...keyword or keyword id number
   kv...keyword value

Fields for sports entries:
    s...sport name or id number
  dst...distance in sport's default units
   hr...duration hours
  min...duration minutes
  sec...duration seconds
  ahr...average heart rate
  mhr...maximum heart rate
    r...route id number
   tp...temperature (default is your default temp units)
   tu...temperature units (overrides your default)
    a...altitude (in users default altitude units)
   au...altitude units (overrides user's defaults)
    e...change in elevation (in users default altitude units)
   eu...change in elevation units (overrides user's defaults)
   pe...perceived effort (valid range 6 to 20)
Field order does not matter. No field should be duplicated.
The Digital Athletic Log will send you an email if it can not ingest the entries to the log. Possible causes include:
You may override the sport's default units with the `du' field. Valid distance abbreviations are m, mi, km, and yd. The following example specifies a 5 km run.
u=joeuser|s=running|d=8/2/04|t=4pm|min=21|dst=5|du=km|
You may create a linked sport and keyword entry (both having the same date and time) by specifying both in a single entry. Combining the previous examples to create a `running' sport entry which is linked to a 'pushup' keyword entry, send the following:
u=joeuser|s=running|d=8/2/04|t=4pm|min=21|dst=5|du=km|k=pushups|kv=100|
The remarks fields is unique in that it can span multiple lines. To span multiple lines it MUST end with a `![]() '. If the remarks fields does not end with a `
'. If the remarks fields does not end with a `![]() ', only the first line is read as the remarks. Consider the following example where the remarks will span multiple lines:
', only the first line is read as the remarks. Consider the following example where the remarks will span multiple lines:
u=joeuser
s=running
d=8/2/04
t=4pm
min=21
dst=5
rmks= This set of remarks
spans multiple lines.
It ends with a vertical bar|
Then consider this example, where only the first line of the 'rmks' field will be saved as the remarks:
u=joeuser
s=running
d=8/2/04
t=4pm
min=21
dst=5
rmks= Only this line will be read
these lines will not be read
because there is NO vertical bar at
the end of the remarks field.
You can enter multiple entries per email by separating them with a `-ne-' (next entry) tag. The following example makes two entries from a single email:
u=joeuser|s=2|d=8/2/04|t=4pm|min=21|dst=5|du=km|
-ne-
u=joeuser|s=2|d=8/3/04|t=4:15pm|min=21|sec=34|dst=4.8|du=km|
Both entries must have a username field (`u') and either a sport (`s') or keyword (`k') field.
Text from the characters `//' to the end of the line is ignored, as is any text between `/*' and `*/'. Lines with no fields in them are also ignored. In the text below, the middle line of the 'rmks' field will not be included in the entry's remarks.
u=joeuser|s=running|d=8/2/04|t=4pm
min=21|dst=5
rmks= most of this remark will be read
// but not this line because it it a comment
however, this line will be read.|
A note, with the email address which made the entry, is added to the remarks field of entries made by email. Normal viewing of the log hides this note. Entries made by email have an `@' symbol in the `other' column of the log.
I have done a lot of testing on the email entry, but I would encourage you to cc: yourself on emails, until you convince yourself that the entries are being made correctly. If you have problems with the email entry feature, please email me (the site administrator) with the email address from which you sent the entry, the date and time you sent the message, the text of the message (if you have a copy), and a description of the problem.
The ``Email Input Admin'' page (the ``entry by email'' link) displays a list of your sport, keyword, and route ID numbers. It also displays a list of all the field tags which can specify data in an email entry. These lists may be sent to an email address for reference.
The field tag list can be sent in a long format, abbreviated, or really abbreviated format:
Field Tag List in Long Format:
Fields for both sport and keyword entries:
    u...username (required)
    d...date of entry
    t...time of entry

Fields for keyword entries:
    k...keyword or keyword id number
   kv...keyword value

Fields for sports entries:
    s...sport name or id number
  dst...distance in sport's default units
   hr...duration hours
  min...duration minutes
  sec...duration seconds
  ahr...average heart rate
  mhr...maximum heart rate
    r...route id number
   tp...temperature (default is your default temp units)
   tu...temperature units (overrides your default)
    a...altitude (in users default altitude units)
   au...altitude units (overrides user's defaults)
    e...change in elevation (in users default altitude units)
   eu...change in elevation units (overrides user's defaults)
   pe...perceived effort (valid range 6 to 20)
Field Tag List in Abbreviated Format
Both:
u=user,d=date,t=time
Kwd:
k=keyword,kv=kw value
Sports:
s=sport,dst=distance,hr=hours,min=minutes,sec=seconds,ahr=ave HR,mhr=max HR,r=route,tp=temp,tu=temp units,a=alt,au=alt units,e=delta elev,eu=delta elev units,pe=effort
Field Tag List in Really Abbreviated Format
u,d,t
k,kv
s,dst,hr,min,sec,ahr,mhr,r,tp,tu,a,au,e,eu,pe
To generate a plot from data in the remarks, enter the `-plot-' tag three time. This separates the remarks into 4 sections (Remarks -plot- Header Info -plot- Data -plot- More Remarks).
Both the remark section and the header section may be empty.
The header section contains the plot title, x axis label, and y axis label all separated by a `;'. The data points are stored as ordered pairs, with each pair separated by a `;' in the data section. For example:
Your remarks here. Just enter text as your normally would
-plot-
title for the plot;
x axis label;
y axis label;
-plot-
x1,y1;
x2,y2;
x3,y2;
etc...
-plot-
For the remarks to be plotted it MUST have the following:
Entries with plot data in their remarks have a `P' displayed in the `other' column of the view log. In normal log viewing the plot data is hidden. Editing the entry will display all the data in the remarks section.
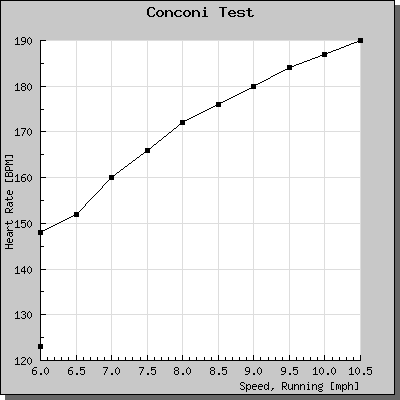
This example uses data from a conconi test. If you are not sure what a Conconi test is, see Reference [2] for more information.
I created a keyword called `Conconi Test'. I stored the data in the remarks section of the keyword entry.
-plot-
Conconi Test;
Speed, Running [mph];
Heart Rate [BPM];
-plot-
6,123;6,148;6.5,152;7,160;7.5,166;
8,172;8.5,176;9,180;9.5,184;10,187;
10.5,190;
-plot-
If you enter data to be plotted in the remarks section and no plot appears after you ``save changes'' to the entry, check the following:
If the city and state you entered does not match a location on the Weather Underground site, follow the link to display the forecast for your zip code (available in the US only). When the forecast is displayed it will provide you with the correct city and state name.
If you follow the `Click here for your Weather Sticker' link at the bottom of the weather underground page, the URL in your browser will be:
http://www.wunderground.com/geo/BannerPromo/US/{state}/{city}.html
Where {state} and {city} are the values you should enter for your city and state.
To display weather for locations outside the United States you need to do the following:
You can get the five digit weather station ID number by emailing me with your location, or by locating your city's forecast on the weather underground. The URL in your browser will give you the station id number. For example, the URL for Perth Western Australia's forecast is:
http://www.wunderground.com/global/stations/94610.html The weather station ID number is the 5 digits just before the ``.html'', or 94610 in this case.
To indicate that a particular piece of equipment has been used during a sport entry, link the equipment's keyword to the sport entry. You link a keyword to a sport entry by selecting the keyword from the ``keyword to add'' menu on the ``sport entry'' page. See Section 12.1 for more information on linking keyword and sport entries.
The main page will display a summary of the total distance and time the equipment definition has been logged. The distances and times are based on the distances and times entered for the sport entry. The keyword
Edit your profile to set the level sharing for your log. There are four levels of log sharing.
To view other users shared logs, follow the the ``View Shared Logs'' link.
If you have a level of sharing enabled, you and others can get an RSS feed with your last 7 days of sport entries. This allows your friends or coaches to follow your training in their favorite news/rss reader. Additionally, many blogs will accept RSS feeds. So using an RSS feed is a good way of incorporating your recent workouts into your blog.
To get the RSS feed for your site, first enable some level of sharing in your profile (as described above). Then go to the view shared logs page. When you display a user's recent entries with this page, there is a link to the RSS feed. Follow the RSS link. The URL for RSS is in your browser's address bar. Copy and paste this URL into your RSS reader or blog.
If at anytime you would like to stop making your RSS feed available, disable sharing in your profile and no further RSS feeds will transmitted.
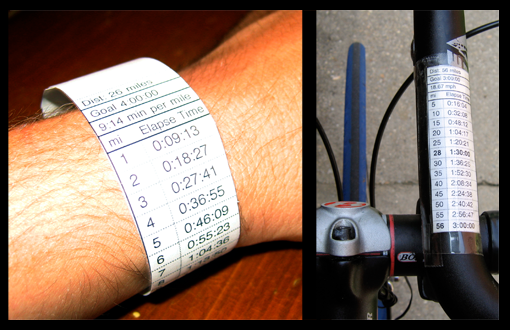
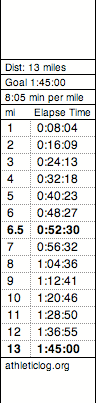
The Split Time Wristband Generator calculates and displays elapse times at various mile or km marks for a given distance and goal time. The list is formatted to be worn as a wristband during the run or ride. I use it for my marathons and triathlons.
The wristband and a stop-watch allow you to determine at a glance if your are ahead or behind your goal pace.
For longer events (particularly when biking) you may not want an elapse time listed for every mile or km. The page can be set to only display elapse time information for every 2nd, 3rd, 5th or 10th mile/km. The elapse time at the halfway point is always printed.
The calculated pace may be set to: minutes per mile, minutes per km, mph, or kph. These units are independent from the goal distance's units (i.e. you can enter a distance of 180 km, and have pace calculated in mph).
I put a layer of clear tape over the printed part of the wristband to keep the type from bleeding when it gets wet.
The Digital Athletic Log can calculate the estimated heart rate limits for your training zones in three ways.[3, pp 39-42]
First your maximum heart rate is estimated from your age by:
| Men: |
|
| Women: |
|
Next, the training zones are calculated from the difference between your resting heart rate and your maximum heart rate using:
![]()
The values used for
![]() are:
are:
| Zone |
|
|
| Lower | Upper | |
| Level 1 | 0.60 | 0.70 |
| Level 2 | 0.71 | 0.75 |
| Level 3 | 0.76 | 0.80 |
| Level 4 | 0.81 | 0.90 |
| Level 5 | 0.91 | 1.00 |
|
The Digital Athletic Log will recognize many more colors (both by name and hex code) than those shown in Figure 39. However, this should be enough to get you started color coding your sports. If you don't see your favorite shade of chartreuse or lemon chiffon, a quick internet search for ``html color codes'' will produce plenty of results.
What follows are examples of ways which I use the features of the Digital Athletic Log. There are many more ways the Digital Athletic Log can be used. If you have questions about how to use a particular feature please email me!
There are many ways of using keywords to augment your sport entries. Here are some examples.
You can use a ``planned event'' keyword to have the main page display the number of weeks and days until an event (Figure 40). I can use this to tell, at a glance, how many easy and hard training weeks I can fit in between now and an event. See Section 5.3 for information on how to set up and use the ``planned event'' keyword.
One of the largest factors in daily weight variation is your hydration level. Weighing yourself before and after a long workout is a good way of estimating your fluid loss. This tells me how much more I need to drink to re-hydrate. Also, by tracking my long term weight trends I can estimate if I am are eating enough. If I consistently find myself on the light side, I know I need to be drinking and eating more. The blue line in Figure 41 is an example of my long term weight data. Reference [1, pp 187] has some good discussion on the pitfalls of placing too much emphasis on your weight while training.
Your resting heart rate is an excellent measure of your overall fitness level. Resting heart rate is also used in the age based calculation of your training zones. You should calculate your resting heart rate by averaging your morning heart rate on at least three different mornings. Reference [3, pp 36] states that a morning pulse of 10% above average can be an indication of getting sick, training too hard, not getting enough sleep, emotional stress, or low hydration. To be able to see these changes you need to be logging your morning heart rate regularly. The red line in Figure 41 is an example of my long term morning heart rate trend. Notice the plot has calculated the average morning heart rate for the data displayed.
If you participate in triathlons it may be useful to log your T1 and T2 transition times in their own keywords. This will allow you to quickly compare all of your transitions and any remarks you have on what went well and poorly. I store my transitions in minutes. So, if I have 1 min 30 second T2 transition, then I make an entry of 1.5 minutes in the T2 keyword.
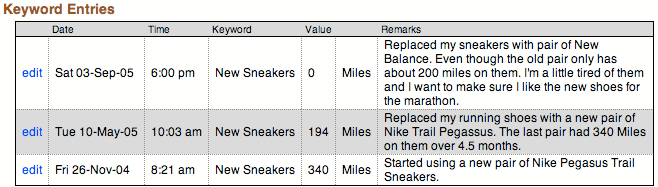
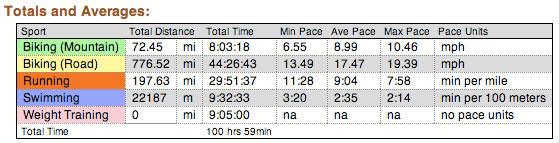
Every time I start using a new pair of running sneakers I make an entry in my `New Sneaker' keyword. The keyword entry's date is the date I start using the new sneakers. I can have the Digital Athletic Log calculate the total miles run in a pair of sneakers by using the `View Log' page.
To look at all the dates I have replaced sneakers, I use the `View Log' and set the filter to only display the `New Sneaker' keyword.
I set the start and end dates to the dates of the sneaker use and check the `View Log Totals' checkbox, the mileage displayed for running is the value I assume for the sneaker mileage. This assume that ALL the running was done in the sneakers in question, which for me is true.
I store the milage as the value of the sneaker's ``New Sneaker'' keyword. Figure 42 shows examples of my ``New Sneaker'' keyword listing, and the listing of log totals to calculating the mileage run in a pair of sneakers.
|
After considering and trying several techniques for storing my weight lifting in the log, I have finally settled on the following:
I created a sport called `Weight Training' with pace units of `none'. When I make sport entries for weight training, I enter the duration and don't enter a distance. This allows the time spent lifting to be reflected the plots of hours per week (Figure 22).
To keep track of how much I'm lifting I use the following short hand: (lbs)x(reps), (reps), (reps). For example.
Situps: 100
Incline Squats: 225x12,15,20
Leg Ext: 100x10,10,10
Leg Curls 135x10,10,10
Pull Downs: 110x10,10,9
Row Pulls: 90x10,10,10
Bench: 80x10,10,10 (FW)
Flys: 50x10,10,10 (FW)
Sit Mil Bench: 50x10,9,9 (FW)
Bis: 60x10,10,10
Tris: 80x10,10,10
The (FW) means `free weights'.
When I want to compare my long term progress I go to the ``View Log'' page and select `Filter by sport Weight Training'.
The ``View Log'' page, allows one to perform text searches on the remarks fields of sport and keyword entries. I use this feature to help review my log. If I have problems with my bike, shoes, Camelbak, or any other piece of equipment, I describe the problem in the remarks after the words ``GEAR ISSUES:''. If anything hurts or aches, I write a description after the words ``ACHES AND PAINS:''.
Later if I want to look at all the equipment problems/comments I have made, I can just search on the word ``GEAR'' and all those entries will be displayed. Likewise, if want to find all the times things have hurt I can search on the word ``aches''.
Here is an example entry with both ``gear'' and ``aches'' flag words in it:
Race #1 of the Cranky Monkey Mountain Bike Series
I raced in the Sport Category. I probably should have run in the
beginner category. I was the second to last in the pack at the start.
I managange to work my way up 10ish places to 54 of 64.

The course was great. I was pleased with my skills. I made all the
stream crossings, and there was only 1 log I didn't ride over. I just
need to be in better shape to keep the speed up.

GEAR ISSUES: 3/4 of the way through lap 1, my seat came loose,
causing it to tilt back. I had to stop and fix it. Even so I did not get it
completely level again. I need to paint a mark on it (and tighten it
before the race). I didn't use the lock out lever much. I think I need
to rotate it so it is easier to switch from lockout to full travel.

ACHES AND PAINS: Right brake handle/shifter rubbed some of the
skin off my thumb joint.
The word you pick to search for entries with must be at least 4 letters long. Also searching on ``ache'' will not return entries with ``aches'' in them. You need to search on ``aches'' or ``ache*''. See Section 6.3 for a complete description of the text searching rules.
This section describes how I use the Digital Athletic Log in conjunction with the the method described in SERIOUS Training for Endurance Athletes by Rob Sleamaker and Ray Browning. The book is packed full of good information, which can overwhelm a beginner. The Digital Athletic Log has several features designed to work with this method.
Update on 5 September 2005: Currently I find tracking more than one or two sports with the SERIOUS method a lot of work. So I pick the two sports I'm best at (running and biking), where focused advanced training will help me. In swimming, I'm still mastering the basics of good form, so I don't worry about things like speed workouts etc.
First I found my training zones. I measured my resting heart rate for three morning in a row (before getting out of bed), and averaged them to find my resting heart rate. I entered my resting heart rate, date of birth, and gender in my profile. The Digital Athletic Log calculated a table of my training zones.
The worksheet can also calculate these training zones. Reference [1, Appendix B] has some good information on determining training zones.
On the `Cycle' sheet of the worksheet. I entered the percent time for each sport in each training type (Speed, Endurance, etc.). Then I entered the periodization for each week. The example training plans in Appendix B of SERIOUS Training for Endurance Athletes is an excellent source of values for this part too.
Now the long term training plan is complete.
I created sports in the Digital Athletic Log for each of my sports (see Section 4.1. Additionally, I created a sport for strength training.
Next I created keywords for each component of the SERIOUS method, except strength (Speed, Endurance, Race/Pace, Interval, Overdistance, Up/Vertical). When I created the keywords, I started them all with the same letter. This causes them all to appear next to each other in the keyword menu. My keywords are `tz Speed', `tz Endurance', `tz Race/Pace', etc. They store the time spent on the particular workout type, and their units are minutes.
At the end of the week I create the goals for the following week. The strength training goal is a type 'Sport Time' using my strength training sport. The other goals are of type `Sum Keyword by Sport'. Where I specify the sport and the keyword corresponds to the workout type. Here the goal value is in minutes (the same units as the keyword). I get the values from the appropriate week in the worksheet.
As I complete my workouts I enter them in the log. So if I did an hour run with 40 minutes of Overdistance and 20 minutes of Endurance, I make a running entry with a duration of 1 hour, and I link two keywords two the sport entry. The `tz Overdistance' with a value of 40, and the `tz Endurance' with a value of 20 minutes.
I enter goals for a couple of different training zone for running, because that is my best sport. The Biking and Swim I have found that just entering time (duration) goals is sufficient.
I can check my progress towards my goals at any time using the ``View Goals'' page.
Update on 26 SEP 05: Opera 8.5 on OS X does a poor job of rendering the login page. It does't seem to have problems rendering the rest of the site.
Internet Explorer 5 (Mac) and Netscape 4 do a poor job. If you must use these much older browsers (IE5 or Netscape 4) to browse the Digital Athletic Log, I recommend you turn off stylesheets (in the advanced section of the preferences). The display will lack color and formatting, but it will be useable (I have tested this).
Printing your data from the Digital Athletic Log's `Export' page works properly on most modern browsers. Firefox, Opera, Internet Explorer, and Safari have all been tested successfully. Older versions of Safari may crash when the report is printed. Upgrading to version 1.3 or later fixes this.
The Digital Athletic Log has also been tested successfully with several text browsers, including: lynx, links, elinks, and w3m.
I'm looking for data on how well the Digital Athletic Log performs on handheld browsers. I have tested it using Opera's Small Screen Rendering (SSR) technology.
Please contact me if the Digital Athletic Log is not displaying properly in your browser. My goal is to make the Digital Athletic Log as accessible as possible.
Version 1.8: November 12th, 2006
Version 1.7.4: October 10th, 2006
Version 1.7.3: March 3rd, 2006
Version 1.7: March 3rd, 2006
Version 1.3: February 26th, 2006
Version 1.2.2: February 12th, 2006
Version 1.2.1: January 13th, 2006
Version 1.2: January 5th, 2006
Version 1.1.16: December 28th, 2005
Version 1.1.15: November 3th, 2005
Version 1.1.14: October 9th, 2005
Version 1.1.13: September 30th, 2005
Version 1.1.12: September 26th, 2005
Version 1.1.11: September 12th, 2005
Version 1.1.10: September 6th, 2005
Version 1.1.9: September 5th, 2005
Version 1.1.8: September 1st, 2005
Version 1.1.7: August 27th, 2005
Version 1.1.6: August 14th, 2005
Version 1.1.5: August 10th, 2005
Version 1.1.4: August 4th, 2005
This document was generated using the LaTeX2HTML translator Version 2002-2-1 (1.70)
Copyright © 1993, 1994, 1995, 1996,
Nikos Drakos,
Computer Based Learning Unit, University of Leeds.
Copyright © 1997, 1998, 1999,
Ross Moore,
Mathematics Department, Macquarie University, Sydney.
The command line arguments were:
latex2html -dir=/Users/rcortesi/mysvn/www/projects/athleticlog/trunk/docs-html/html_single/ -split=0 athlog_help.tex
The translation was initiated by Roger Cortesi on 2006-11-12